Kafka KRaft Monitoring with Prometheus and Grafana
In this post, I will explain how to configure a popular monitoring stack composed of Grafana (data visualization) and Prometheus (time-series database) to analyze metrics from a Kafka cluster.
In one of my previous posts, I explained how to configure a Kafka cluster running in KRaft mode. The same cluster setup will be used as our target system to monitor.
Pre-requisites: basic knowledge of Docker, Compose, and Kafka. As for Grafana and Prometheus, I will give a quick overview of their usage. For more information, please refer to the respective documentation of each of them.
Monitoring
Monitoring is something frequently overlooked. When we think about new systems, especially in the small to medium size range, we want to develop fast and ship our projects to our customers, and configuring a monitoring stack can be seen as a tedious/second importance task.
This mentality becomes an issue when a company starts to experience fuzzy bugs, lack of performance, poor availability, network errors, or other types of problems. To address this issue, a popular and industry-tested stack is the duo Prometheus + Grafana.
Prometheus Overview
Prometheus is a monitoring system and time-series database. It is used to store data in the timestamp and key-value pair format. The power of Prometheus comes from it’s powerful query language (PromQL), efficient storage, simple configuration, wide range of client libraries and extensive number of exporters.
The Overview page of the documentation gives a solid starting-point to getting more knowledge about Prometheus.
Grafana Overview
Grafana is an observability framework that ships with powerful dashboards and integrations with different data sources that highly enhances the visualisation of data. Besides dashboards to visualise metrics, it is also possible to configure alerts or Grafana Loki (specialised in logs), but they are out of the scope of this post.
For more information about Grafana, see its documentation. The Introduction to Time Series section is particularly helpful for understanding this post.
Now that we understand the tools we will use, let’s start working on our system.
Configuration
Before starting the cluster, let’s create the network we are going to use to communicate our cluster to our monitoring stack:
docker network create monitoringThis change allows us create multiple docker-compose files to isolate our services based on their responsibilities. It will help avoid having a big docker-compose with multiple services doing different things.
In the controllers and brokers specification file (code is in my GitHub), I will add the network we just created.
version: "3"
services:
  controller-1:
    image: confluentinc/cp-kafka:7.5.0
    profiles: ["ctl", "all"]
    hostname: controller-1
    container_name: controller-1
    networks:
      - monitoring
...
networks:
  monitoring:
    external: true
I will also create two folders: one for the cluster (/kafka) and another for the monitoring stack (/monitoring).
The command to start the cluster, running from the root of the project, will be the following:
docker compose -f kafka/docker-compose.yaml --profile all upAfter it has finished starting, we are ready to configure our monitoring tools.
Prometheus
Prometheus fetches metrics from services / exporters in its specific metrics types. An exporter, in our context, is a software responsible for exposing metrics from a system and configuring it to Prometheus standard. For our setup, I will be using two types of exporters: the Bitnami JMX Exporter (wrapper on top of the Prometheus JMX Exporter) and the Bitnami Kafka Exporter (wrapper on top of the Prometheus JMX Exporter). Obs: we need to use a separate exporters because, at the time of writing, Kafka does not export its metrics in Prometheus standard by default. Instead it uses JMX, a technology for monitoring and managing Java applications. See Monitoring Kafka with JMX for more information.
The exporters will be services in a new docker-compose.yml file located inside the /monitoring folder. It will look like the following:
version: "3"
services:
  kafka-exporter:
    image: bitnami/kafka-exporter:1.7.0
    command:
      - "--kafka.server=broker-1:9092"
      - "--kafka.server=broker-2:9092"
      - "--kafka.server=broker-3:9092"
    ports:
      - 9308:9308
    networks:
      - monitoring
  jmx-exporter-broker:
    image: bitnami/jmx-exporter:0.20.0
    volumes:
      - ./exporter/exporter-brokers.yml:/opt/bitnami/jmx-exporter/exporter.yml
    command:
      - "5556"
      - exporter.yml
    ports:
      - 9999:5556
    networks:
      - monitoring
  jmx-exporter-controller:
    image: bitnami/jmx-exporter:0.20.0
    volumes:
      - ./exporter/exporter-controllers.yml:/opt/bitnami/jmx-exporter/exporter.yml
    command:
      - "5556"
      - exporter.yml
    ports:
      - 9998:5556
    networks:
      - monitoring
networks:
  monitoring:
    external: true
Side note: a good practice is to use version tags in your images instead of the latest tag. Using the latter can cause unwanted version updates and create problems while running in a deployed environment.
For the JMX exporters, I also created two configuration files (one for the controller and one for the brokers) to indicate which metrics we will be scraping. The code can be found here.
Let’s start the exporters with the command:
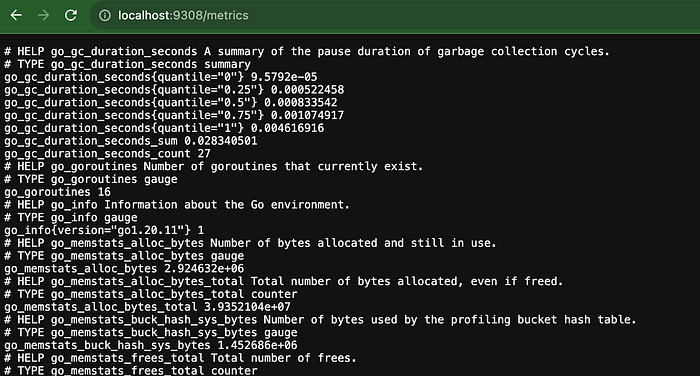
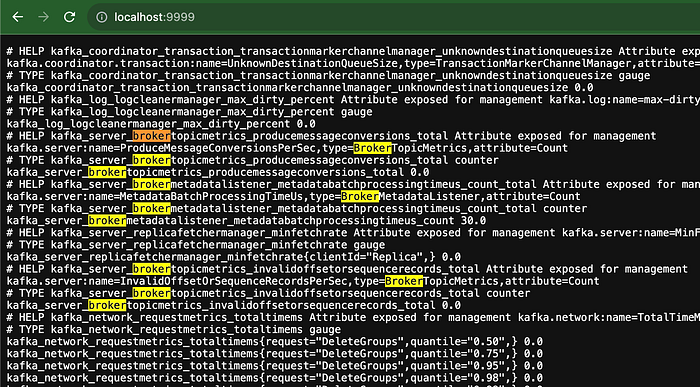
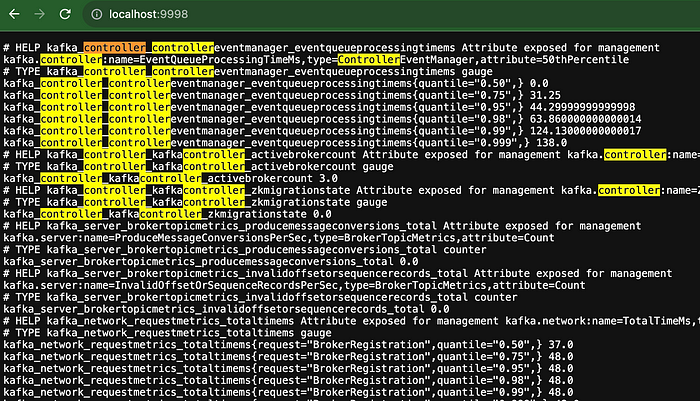
docker compose -f monitoring/docker-compose.yaml upIf there are no errors, you should see a message that all exporters started and are listening on port 5556 (jmx) or 9308 (kafka). In the docker compose, we mapped the ports 9999 and 9998, for the broker and controllers exporters, respectively, in the host to the port 5556 of our exporter services and the port 9308 to the same one in the kafka exporter. After accessing each one of them, we should see the following:
Now that we have the exporters running, let’s configure Prometheus to fetch it’s metrics.
We we will use the Bitnami Prometheus Image hosted on docker hub to configure our service(the reason to choose this image was that it is from the same distributor and supposedly receives the same support). The service in the docker-compose will look like the following:
...
  prometheus:
    image: bitnami/prometheus:2.48.0
    volumes:
      - ./prometheus/prometheus.yml:/opt/bitnami/prometheus/conf/prometheus.yml
    ports:
      - 9099:9090
    networks:
      - monitoring
...
Before we start it, we need to add a prometheus.yml configuration file. In this fie, we configure prometheus to know which servers to scrape and how(e.g authentication or alternative routes to fetch the metrics). We will use all the defaults values and only add a new job to scrape metrics from our pre-configured exporters. The file will look like the following:
# my global config
global:
  scrape_interval: 15s # Set the scrape interval to every 15 seconds. Default is every 1 minute.
  evaluation_interval: 15s # Evaluate rules every 15 seconds. The default is every 1 minute.
  # scrape_timeout is set to the global default (10s).

# A scrape configuration containing exactly one endpoint to scrape:
# Here it's Prometheus itself.
scrape_configs:
  # The job name is added as a label `job=<job_name>` to any timeseries scraped from this config.
  - job_name: "prometheus"
    # metrics_path defaults to '/metrics'
    # scheme defaults to 'http'.
    static_configs:
      - targets: ["localhost:9090"]
  - job_name: "kafka"
    static_configs:
      - targets:
        - jmx-exporter-broker:5556
        - jmx-exporter-controller:5556
        - kafka-exporter:9308
Now let’s start the prometheus service with the same command we used for the exporters. After if finishes, the web client should be accessible on localhost:9099 in the host. We can navigate to http://localhost:9099/targets?search= and check that our targets are successfully scraped.
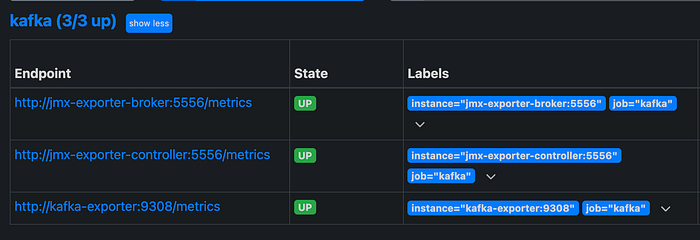
Now that we know that both our exporters are reporting as UP, we can try to query the metrics that we previously requested on localhost:9999/metrics, localhost:9998/metrics and localhost:9308/metrics using the Prometheus UI.
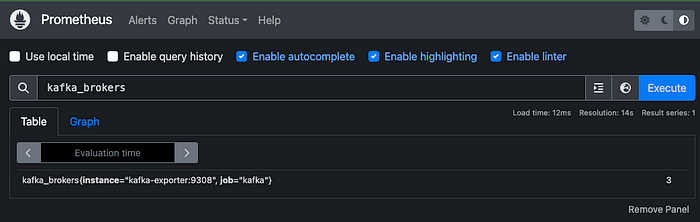

We have now successfully configured our metrics monitoring stack 🚀 Now let’s take our setup to the next level and configure beautiful and powerful dashboard so we can better analyse them.
Grafana
To configure Grafana, we will follow the same process as the other services. We will be using the oficial Grafana Docker image. The configuration of the service will look like the following:
...
  grafana:
    image: grafana/grafana:10.2.2
    environment:
      - GF_SECURITY_ADMIN_PASSWORD=password
    ports:
      - 3000:3000
    networks:
      - monitoring
...
We will configure the connection to Prometheus directly using the Grafana client. Let’s start Grafana with the command we used to start our monitoring stack.
After Grafana finishes starting we should see it running:
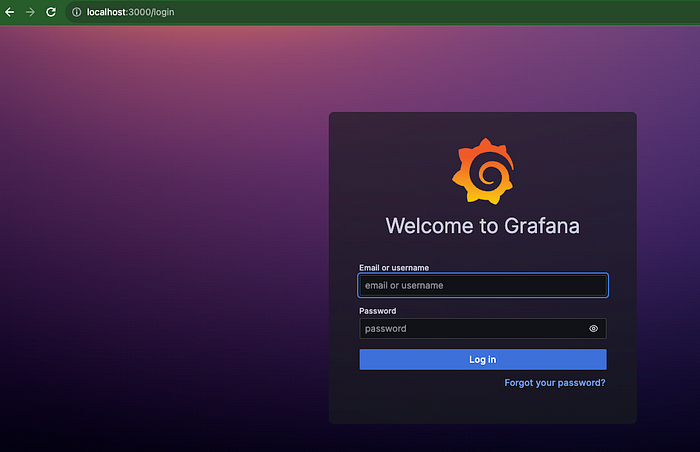
Let’s access using the configured credentials (default user is admin, and we set the password to password) .
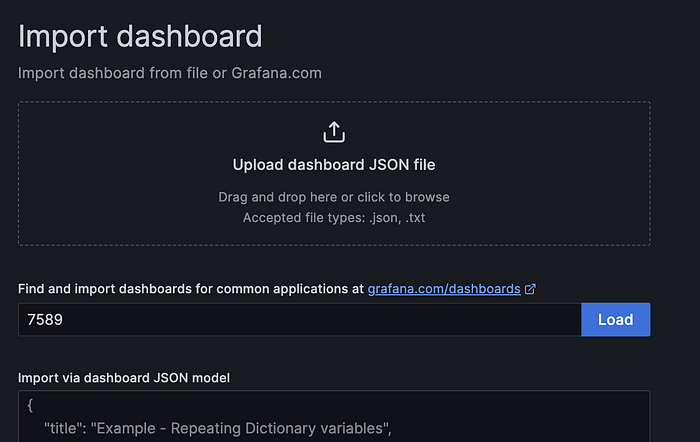
Grafana is a powerful tool, but we will focus only on dashboards in this post. There are many pre-configured ones for a wide range of services in the Grafana Dashboards page. We will use the Kafka Exporter Overview (ID=7589). Back to the client, click on the top middle search bar in Import dashboard. Insert the dashboard ID and click on Load .
After clicking on load, we need to select a Data Souce before finishing its import. Click on the form and in Configure a new data source . You will be redirected to a list of datasources. Many data sources are supported, but we will configure a Prometheus one to use what we have configured before. Click on Prometheus. In the connection, add the following: http://prometheus:9090. We don’t need to change anything else. Scroll down and click on Save & Test . You should see the following:
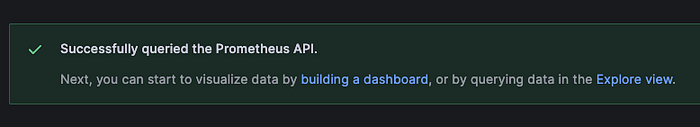
Now we can go back to our import dashboard page, select the configured datasource, and click on Import .
After that you should see something like the following:
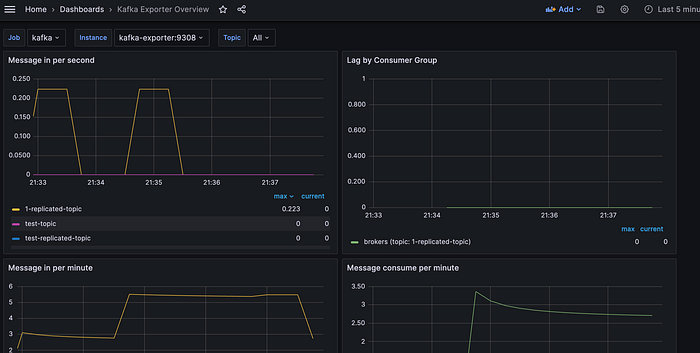
Obs: you may see your empty because you have no data to see. Use your Kafka cluster as described in my previous post to see how to create test messages.
We configured a very popular and robust stack to monitor our application. As mentioned before, it is of extremely importance that we have data to guarantee our services are working as expected. Without much effort, we can configure a powerful stack to give us a good overview of the health of our application.
As always, I hope you found this article helpful. Please feel free to leave any feedback! And see you in the next one 😄.